I think I'm heading in the right direction. I've posted some scatter plots below, showing data from full test drive sessions. It shows AFR reading for various manifold pressures. I think it bettter shows the result of multiple pulls rather than one example pull like I've been posting before.
Here's data from a test drive from several modificattions ago...

Then the next test drive data set is from after the first needle profiling work. Note that the 'hole' in the top right of the scatter plot is growing - ie there are fewer data dots in the mid-range boost and high AFR section, suggesting some improvements when immediately on the throttle.

And then after some further needle profiling. I worked further down the pointy end. Note the hole is growing bigger. and the hole is growing twoards the high boost area - ie fewer high AFR data points in the high boost area.

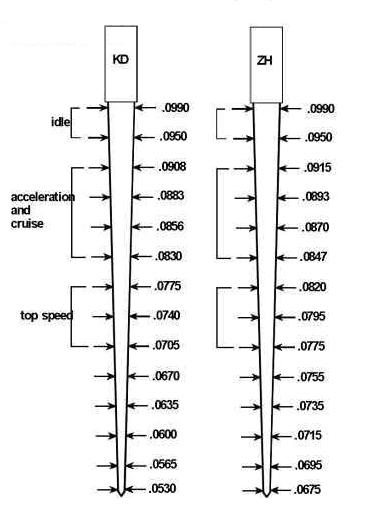
So I'll do a bit more of that profiling including a little more towards the pointier end of the needle.
One thing to note though, these are prettey small sample sizes, about 5 or 6 WOT pulls. So I'm taking the data with a grain of salt, but it does look like its making progress. The low AFR section is growing though, as I richen up the needle, there are 11.5:1 data points in the mid and hi boost area now, but I guess that's the trade-off of modifying the needle?
Here's an example pull from teh last test run session so you can see the improvements in the trace...


